Bi-Directional Regression Analysis Investment Network

|
B.R.A.I.N. Bi-Directional Regression Analysis Investment Network |
|
| B.R.A.I.N. |
|
|
| Performance |
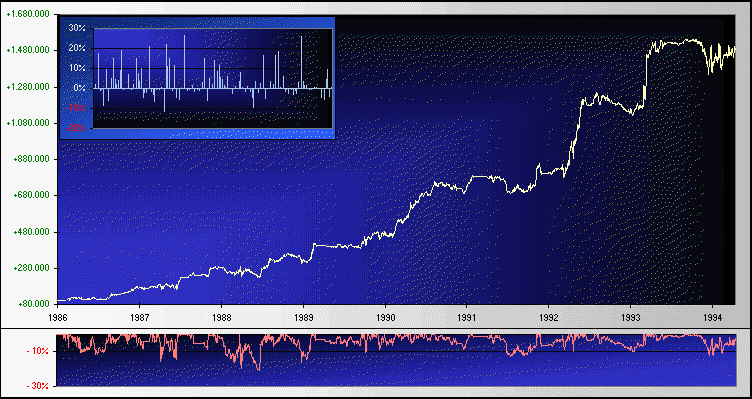
This chart shows the performance
of B.R.A.I.N. from 1986 to 1994.
The small chart in
the left corner are the monthly returns, the red line below
illustrates the drawdown.

© Copyright:
|
All rights reserved.
|
|